-
-
Save hitvoice/36cf44689065ca9b927431546381a3f7 to your computer and use it in GitHub Desktop.
| import numpy as np | |
| import pandas as pd | |
| import matplotlib.pyplot as plt | |
| import seaborn as sns | |
| from sklearn.metrics import confusion_matrix | |
| def cm_analysis(y_true, y_pred, filename, labels, ymap=None, figsize=(10,10)): | |
| """ | |
| Generate matrix plot of confusion matrix with pretty annotations. | |
| The plot image is saved to disk. | |
| args: | |
| y_true: true label of the data, with shape (nsamples,) | |
| y_pred: prediction of the data, with shape (nsamples,) | |
| filename: filename of figure file to save | |
| labels: string array, name the order of class labels in the confusion matrix. | |
| use `clf.classes_` if using scikit-learn models. | |
| with shape (nclass,). | |
| ymap: dict: any -> string, length == nclass. | |
| if not None, map the labels & ys to more understandable strings. | |
| Caution: original y_true, y_pred and labels must align. | |
| figsize: the size of the figure plotted. | |
| """ | |
| if ymap is not None: | |
| y_pred = [ymap[yi] for yi in y_pred] | |
| y_true = [ymap[yi] for yi in y_true] | |
| labels = [ymap[yi] for yi in labels] | |
| cm = confusion_matrix(y_true, y_pred, labels=labels) | |
| cm_sum = np.sum(cm, axis=1, keepdims=True) | |
| cm_perc = cm / cm_sum.astype(float) * 100 | |
| annot = np.empty_like(cm).astype(str) | |
| nrows, ncols = cm.shape | |
| for i in range(nrows): | |
| for j in range(ncols): | |
| c = cm[i, j] | |
| p = cm_perc[i, j] | |
| if i == j: | |
| s = cm_sum[i] | |
| annot[i, j] = '%.1f%%\n%d/%d' % (p, c, s) | |
| elif c == 0: | |
| annot[i, j] = '' | |
| else: | |
| annot[i, j] = '%.1f%%\n%d' % (p, c) | |
| cm = pd.DataFrame(cm, index=labels, columns=labels) | |
| cm.index.name = 'Actual' | |
| cm.columns.name = 'Predicted' | |
| fig, ax = plt.subplots(figsize=figsize) | |
| sns.heatmap(cm, annot=annot, fmt='', ax=ax) | |
| plt.savefig(filename) |
Hi! This plot is GORGEOUS, and I love it! It saves me a lot of time. Thanks so much for sharing it!
However, right now it's set up to generate the heat map based on the overall population of the items in each square. How might I edit the code so that it colors the heat map based on the percentages instead?
Thanks!
EDIT: I figured it out! After the confusion matrix is initially defined I did this:
percents = []
for i in cm:
        total = np.sum(i)
        i = 100*(i/total)
        percents.append(i)
cm = np.array(percents)
Double Edit: I was wrong! I can make a new numpy array of percentages that will guide the heat map, but of course I lose my labels.
@seovchinnikov Thanks! I just added that.
@Mahi-Mai
Just replace line 43 with this line cm = pd.DataFrame(cm_perc, index=labels, columns=labels)
Hi i am getting:
File "/home/vikash/mediumprjct/evalaute_train_test.py", line 230, in
cm_analysis(actual,predict,labels,'tessstttyyy.png')
File "/home/vikash/mediumprjct/evalaute_train_test.py", line 207, in cm_analysis
cm = confusion_matrix(y_true, y_pred, labels=labels)
File "/usr/local/lib/python2.7/dist-packages/sklearn/metrics/classification.py", line 258, in confusion_matrix
if np.all([l not in y_true for l in labels]):
TypeError: iteration over a 0-d array
Y_TRUE = [u'person', u'country', u'person', u'anthem', u'country', u'sport', u'country', u'person', u'person', u'sport', u'country', u'person', u'country', u'person', u'country', u'country', u'person', u'anthem', u'country', u'country', u'person', u'person', u'person', u'continent', u'person', u'person', u'person', u'person', u'country', u'location', u'location', u'continent', u'person', u'person', u'person', u'rhyme_name', u'country', u'location', u'location', u'location', u'location', u'country', u'person', u'country', u'country', u'sport', u'country', u'person', u'rhyme_name', u'continent', u'country', u'river', u'person', u'country', u'person', u'person', u'informal_place', u'location', u'location', u'country', u'animal', u'country', u'person', u'person', u'country', u'anthem', u'person', u'person', u'person', u'country', u'anthem', u'person', u'country', u'animal']
Y_PRED = [u'person', u'country', u'person', u'anthem', u'country', u'country', u'sport', u'person', u'person', u'sport', u'country', u'person', u'country', u'person', u'country', u'country', u'person', u'anthem', u'country', u'country', u'person', u'person', u'person', u'country', u'person', u'person', u'person', u'person', u'country', u'location', u'location', u'continent', u'person', u'person', u'person', u'rhyme_name', u'country', u'location', u'location', u'location', u'location', u'country', u'person', u'country', u'country', u'sport', u'country', u'person', u'rhyme_name', u'continent', u'country', u'river', u'person', u'country', u'person', u'person', u'missed', u'location', u'location', u'country', u'animal', u'country', u'person', u'person', u'country', u'anthem', u'person', u'person', u'person', u'country', u'anthem', u'person', u'country', u'animal', u'country' ]
labels= [u'person', u'country', u'anthem', u'sport', u'continent', u'location', u'rhyme_name', u'river', u'informal_place', u'animal', u'city', u'capital', u'flower', u'bird', u'informal_date', u'state', u'food', u'phrase_to_translate', u'gdp_nominal', u'direction', u'number', u'volume', u'informal_cause', u'motto', u'color', u'date', u'informal_time', u'angle', u'missed']
can you guide me what is the error.
@vikash512 Your "Y_TRUE" has 74 elements and "Y_PRED" has 75 elements, but the numbers of elements are supposed to be equal.
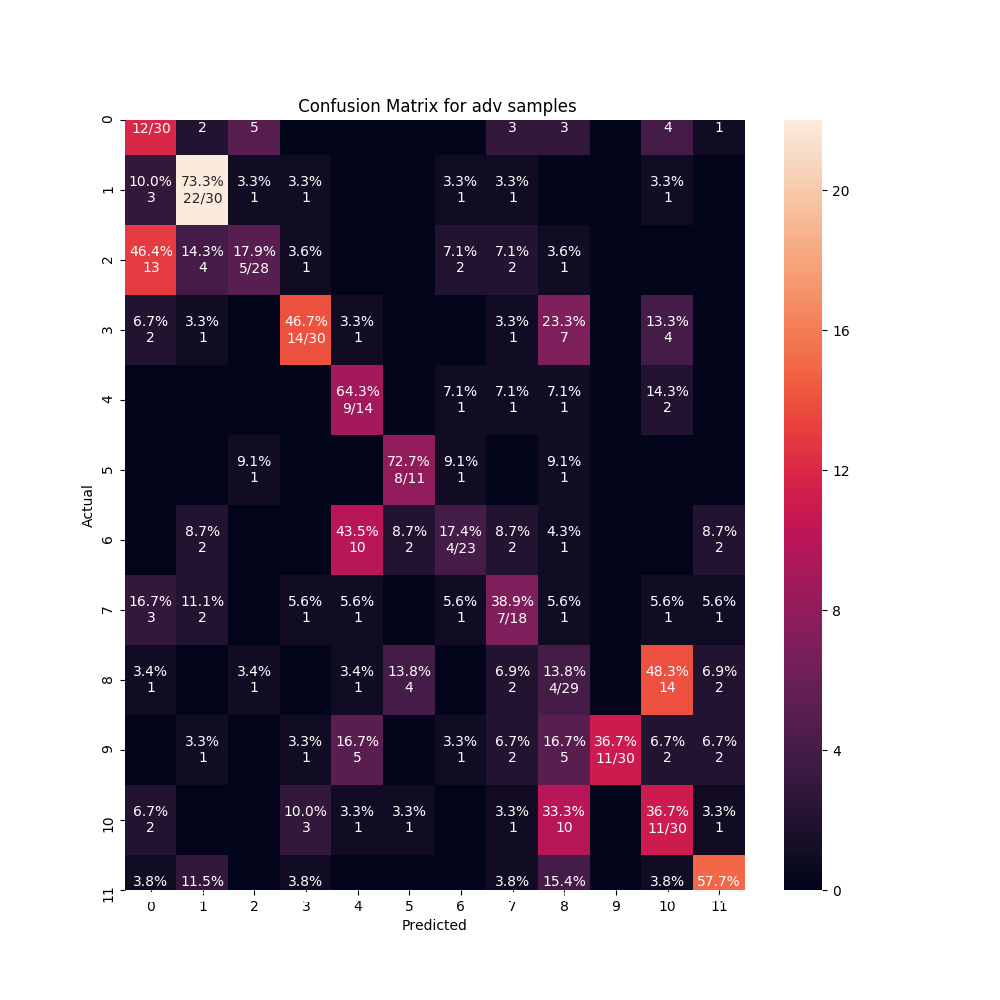
It's the first time I see this kind of oversized figure. Can you share the data you used (or some fake data) that can reproduce this?
PFA the data at https://drive.google.com/open?id=12Gx_O0Sjn0xocGQ-2jvW7Z03-61my29i
Thanks for prompt response.
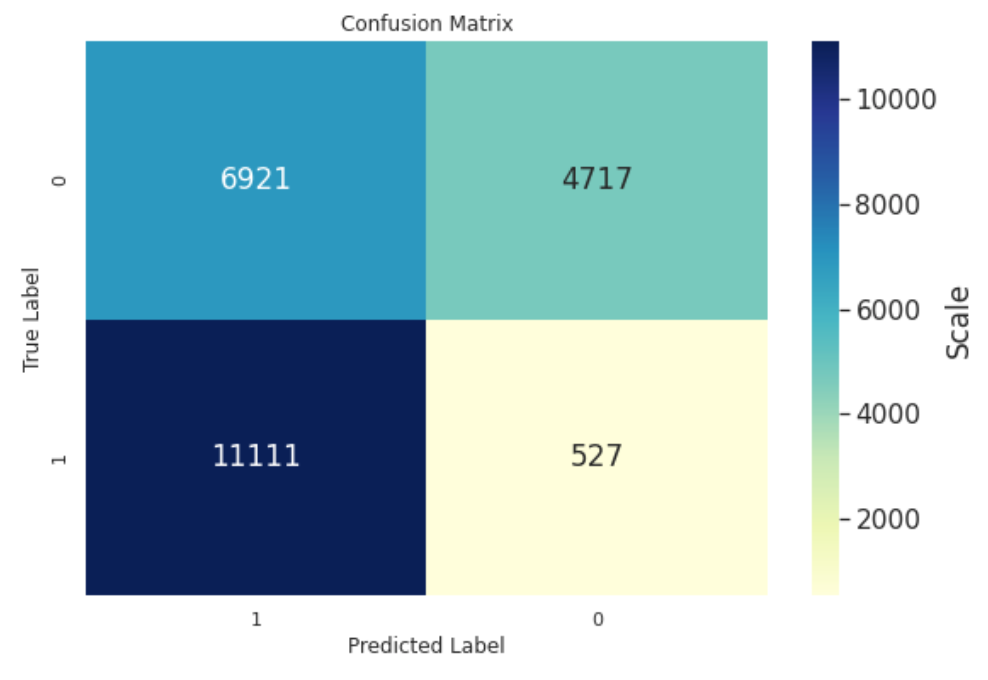
Hi Hitvoice - this is awesome! Thanks so much posting this. I'm trying it out and see an odd thing with my binary classification CM. I've posted your version and what I get from using confusion_matrix. You can see that the classes are transposed and I'm wondering if I'm doing something wrong. I'd like to keep this aligned to what confusion_matrix displays so I thought I'd ask.
Hi Hitvoice - this is awesome! Thanks so much posting this. I'm trying it out and see an odd thing with my binary classification CM. I've posted your version and what I get from using confusion_matrix. You can see that the classes are transposed and I'm wondering if I'm doing something wrong. I'd like to keep this aligned to what confusion_matrix displays so I thought I'd ask.


What do you mean by "the classes are transposed"? Do you mean the order of 0 and 1?
Do you mean the order of 0 and 1?
Yes, I was looking to align this with sklearn's confusion matrix for consistency. Perhaps a parameter could be passed to indicate the order since various references have a different convention for the axes.
You can see from the code that the matrix is indeed computed from sklearn's "confusion_matrix" function. How did you get the first figure? If you prefer that kind of style, you can reorder the dataframe columns by cm = cm[cm.columns[::-1]] before creating the plot.
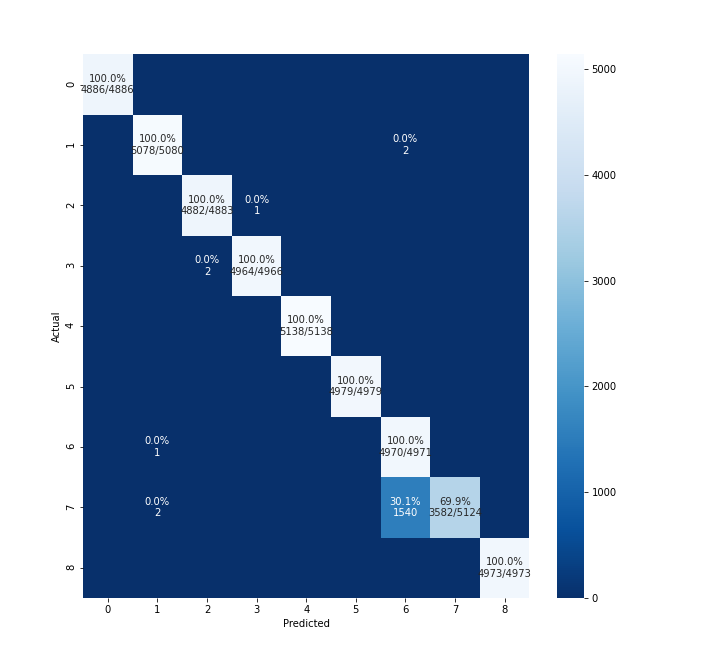
@hitvoice, it's really appreciated work. how to changet the clf.classes_ to other, for instance my classess are from 0 to 8, but i want to change those labels to string.

@rajeshkalakoti pass the value of ymap (dict[Any,str]) to cm_analysis. You can configure the class names in ymap.
for instance, labels are like "class-1, class-2,class-3, class-4,class-5, class-6,class-7, class-8,classs-9", how to configure it?


Nice viz, but it will be good if you can add Python 2 support by adding correct division fix for it:
cm_perc = cm / cm_sum.astype(float) * 100instead of
cm_perc = cm / cm_sum * 100