-
-
Save hitvoice/36cf44689065ca9b927431546381a3f7 to your computer and use it in GitHub Desktop.

| import numpy as np | |
| import pandas as pd | |
| import matplotlib.pyplot as plt | |
| import seaborn as sns | |
| from sklearn.metrics import confusion_matrix | |
| def cm_analysis(y_true, y_pred, filename, labels, ymap=None, figsize=(10,10)): | |
| """ | |
| Generate matrix plot of confusion matrix with pretty annotations. | |
| The plot image is saved to disk. | |
| args: | |
| y_true: true label of the data, with shape (nsamples,) | |
| y_pred: prediction of the data, with shape (nsamples,) | |
| filename: filename of figure file to save | |
| labels: string array, name the order of class labels in the confusion matrix. | |
| use `clf.classes_` if using scikit-learn models. | |
| with shape (nclass,). | |
| ymap: dict: any -> string, length == nclass. | |
| if not None, map the labels & ys to more understandable strings. | |
| Caution: original y_true, y_pred and labels must align. | |
| figsize: the size of the figure plotted. | |
| """ | |
| if ymap is not None: | |
| y_pred = [ymap[yi] for yi in y_pred] | |
| y_true = [ymap[yi] for yi in y_true] | |
| labels = [ymap[yi] for yi in labels] | |
| cm = confusion_matrix(y_true, y_pred, labels=labels) | |
| cm_sum = np.sum(cm, axis=1, keepdims=True) | |
| cm_perc = cm / cm_sum.astype(float) * 100 | |
| annot = np.empty_like(cm).astype(str) | |
| nrows, ncols = cm.shape | |
| for i in range(nrows): | |
| for j in range(ncols): | |
| c = cm[i, j] | |
| p = cm_perc[i, j] | |
| if i == j: | |
| s = cm_sum[i] | |
| annot[i, j] = '%.1f%%\n%d/%d' % (p, c, s) | |
| elif c == 0: | |
| annot[i, j] = '' | |
| else: | |
| annot[i, j] = '%.1f%%\n%d' % (p, c) | |
| cm = pd.DataFrame(cm, index=labels, columns=labels) | |
| cm.index.name = 'Actual' | |
| cm.columns.name = 'Predicted' | |
| fig, ax = plt.subplots(figsize=figsize) | |
| sns.heatmap(cm, annot=annot, fmt='', ax=ax) | |
| plt.savefig(filename) |
It's the first time I see this kind of oversized figure. Can you share the data you used (or some fake data) that can reproduce this?
PFA the data at https://drive.google.com/open?id=12Gx_O0Sjn0xocGQ-2jvW7Z03-61my29i
Thanks for prompt response.
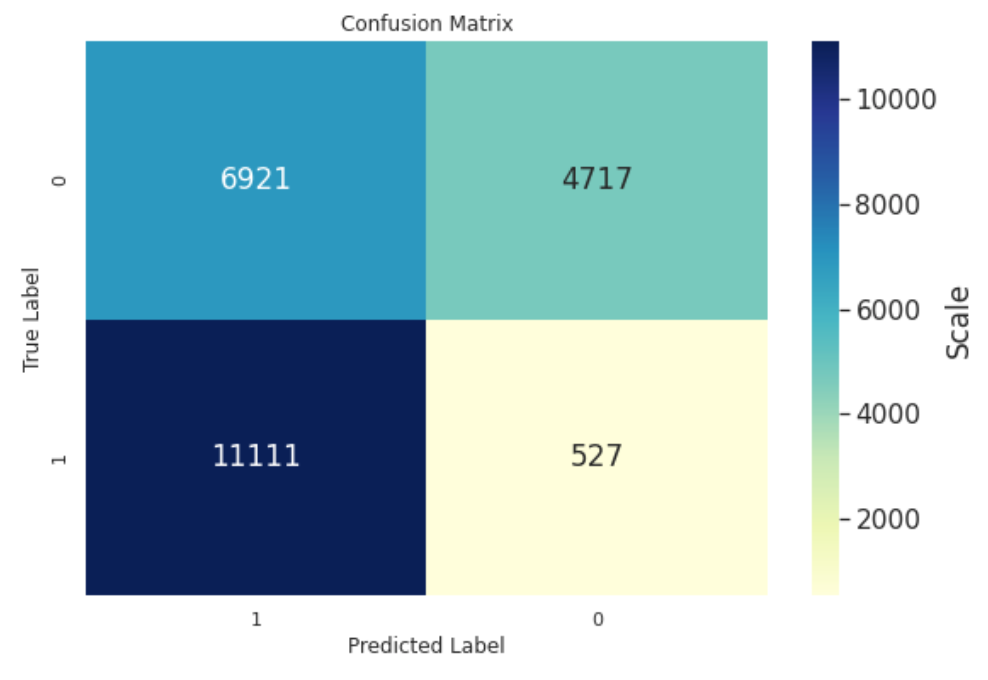
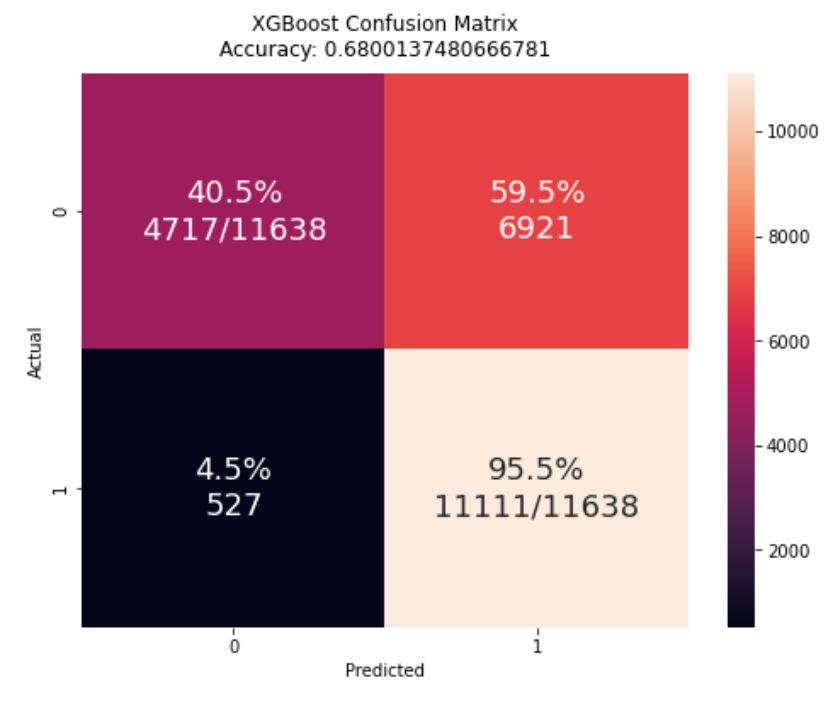
Hi Hitvoice - this is awesome! Thanks so much posting this. I'm trying it out and see an odd thing with my binary classification CM. I've posted your version and what I get from using confusion_matrix. You can see that the classes are transposed and I'm wondering if I'm doing something wrong. I'd like to keep this aligned to what confusion_matrix displays so I thought I'd ask.
Hi Hitvoice - this is awesome! Thanks so much posting this. I'm trying it out and see an odd thing with my binary classification CM. I've posted your version and what I get from using confusion_matrix. You can see that the classes are transposed and I'm wondering if I'm doing something wrong. I'd like to keep this aligned to what confusion_matrix displays so I thought I'd ask.
What do you mean by "the classes are transposed"? Do you mean the order of 0 and 1?
Do you mean the order of 0 and 1?
Yes, I was looking to align this with sklearn's confusion matrix for consistency. Perhaps a parameter could be passed to indicate the order since various references have a different convention for the axes.
You can see from the code that the matrix is indeed computed from sklearn's "confusion_matrix" function. How did you get the first figure? If you prefer that kind of style, you can reorder the dataframe columns by cm = cm[cm.columns[::-1]] before creating the plot.
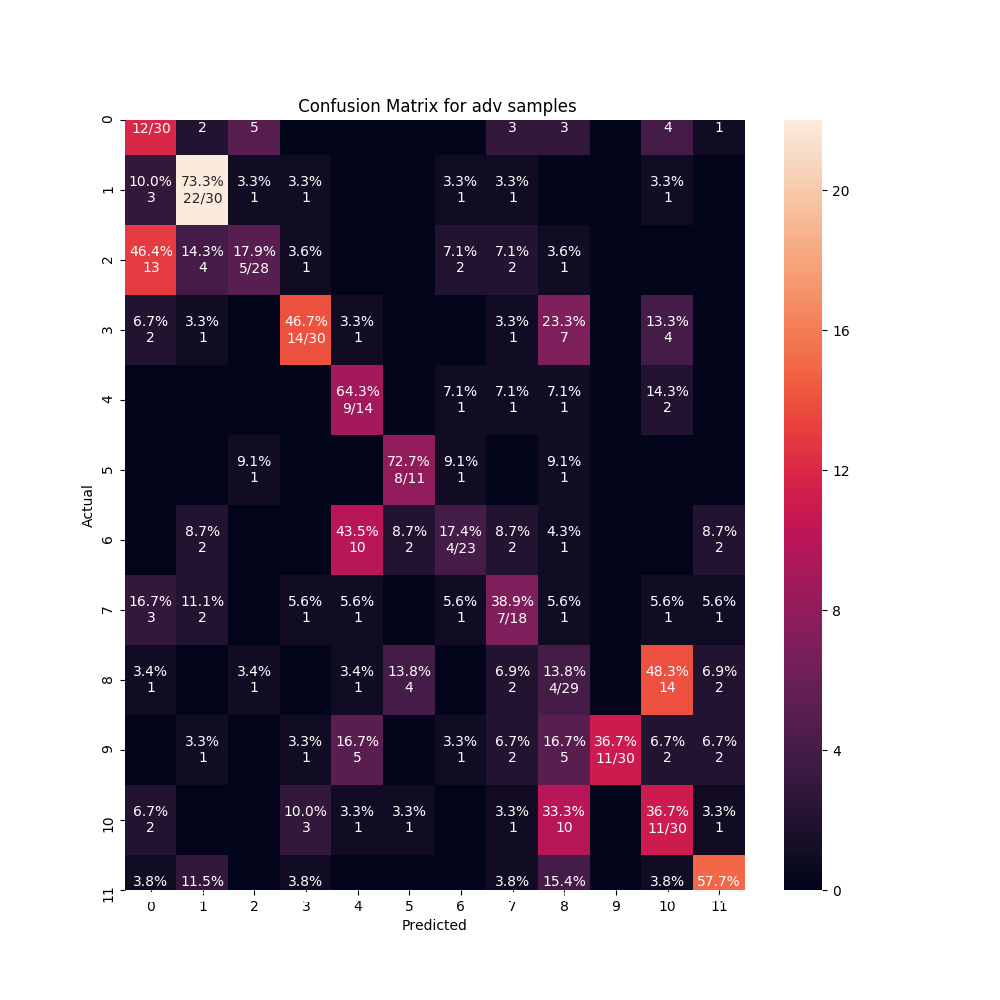
@hitvoice, it's really appreciated work. how to changet the clf.classes_ to other, for instance my classess are from 0 to 8, but i want to change those labels to string.
@rajeshkalakoti pass the value of ymap (dict[Any,str]) to cm_analysis. You can configure the class names in ymap.
for instance, labels are like "class-1, class-2,class-3, class-4,class-5, class-6,class-7, class-8,classs-9", how to configure it?
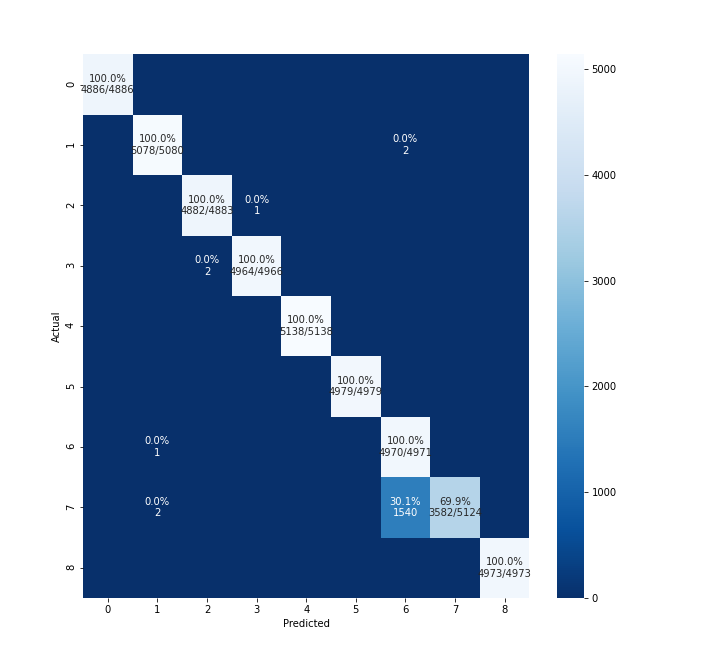
Hello,
Thanks for sharing the code.
CM plot with my dataset seems to miss the top row and bottom row elements. PFA the output.
Can you please share how to resolve this. I tried increasing fig size but it didn't help.