Last active
October 14, 2019 13:08
-
-
Save rafapereirabr/f6bdc68dcc1dc7cae5c7cb4c3f16924d to your computer and use it in GitHub Desktop.
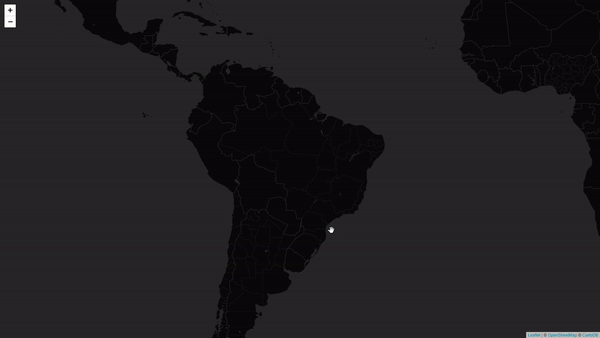
Interactive map or large spatial data sets (demo geobr)
This file contains hidden or bidirectional Unicode text that may be interpreted or compiled differently than what appears below. To review, open the file in an editor that reveals hidden Unicode characters.
Learn more about bidirectional Unicode characters
| # Libraries | |
| library(geobr) | |
| library(leafgl) | |
| library(leaflet) | |
| library(sf) | |
| library(colourvalues) | |
| # get data of disaster risk areas in Brazil using the geobr package | |
| d <- geobr::read_disaster_risk_area(year=2010) | |
| # format conversion to work in leafgl | |
| d2 <- sf::st_cast(d, 'POLYGON') | |
| # set colors | |
| cols = colour_values_rgb(d$code_state, palette = "inferno", include_alpha = FALSE) / 255 | |
| # Plot map | |
| leaflet() %>% | |
| addProviderTiles(provider = providers$CartoDB.DarkMatterNoLabels) %>% | |
| addGlPolygons(data = d2, group = "pols", color= cols) | |
Author
rafapereirabr
commented
Oct 14, 2019
Sign up for free
to join this conversation on GitHub.
Already have an account?
Sign in to comment