start new:
tmux
start new with session name:
tmux new -s myname
| #!/usr/bin/env python | |
| from numpy import asmatrix, asarray, ones, zeros, mean, sum, arange, prod, dot, loadtxt | |
| from numpy.random import random, randint | |
| import pickle | |
| MISSING_VALUE = -1 # a constant I will use to denote missing integer values | |
| def impute_hidden_node(E, I, theta, sample_hidden): |
I recently needed a way to run unit tests on Travis for a project that uses Sun Grid Engine, Grid Map. Unfortunately, it seemed like no one had figured out how to set that up on Travis before (or simply create a single-machine installation without any user interaction). After hours of trial-and-error, I now know the secrets to making a single-machine installation of SGE that runs on Travis, and I'm sharing my script to prevent other people from going through the same frustrating experience.
To use the install_sge.sh script below, you just need to copy all of the files in this gist to a travis sub-directory directly under the root of your GitHub project, and add the following lines to your .travis.yml
before_install:
  - travis/install_sge.sh
  - export SGE_ROOT=/var/lib/gridengine
  - export SGE_CELL=default
- export DRMAA_LIBRARY_PATH=/usr/lib/libdrmaa.so.1.0| curl -O -L http://sourceforge.net/projects/bowtie-bio/files/bowtie/0.12.7/bowtie-0.12.7-linux-x86_64.zip |
| source("http://bioconductor.org/biocLite.R") | |
| biocLite("genomes") | |
| library(genomes) | |
| library(ggplot2) | |
| valid <- c("released", "created", "submitted") | |
| data(proks) | |
| update(proks) |
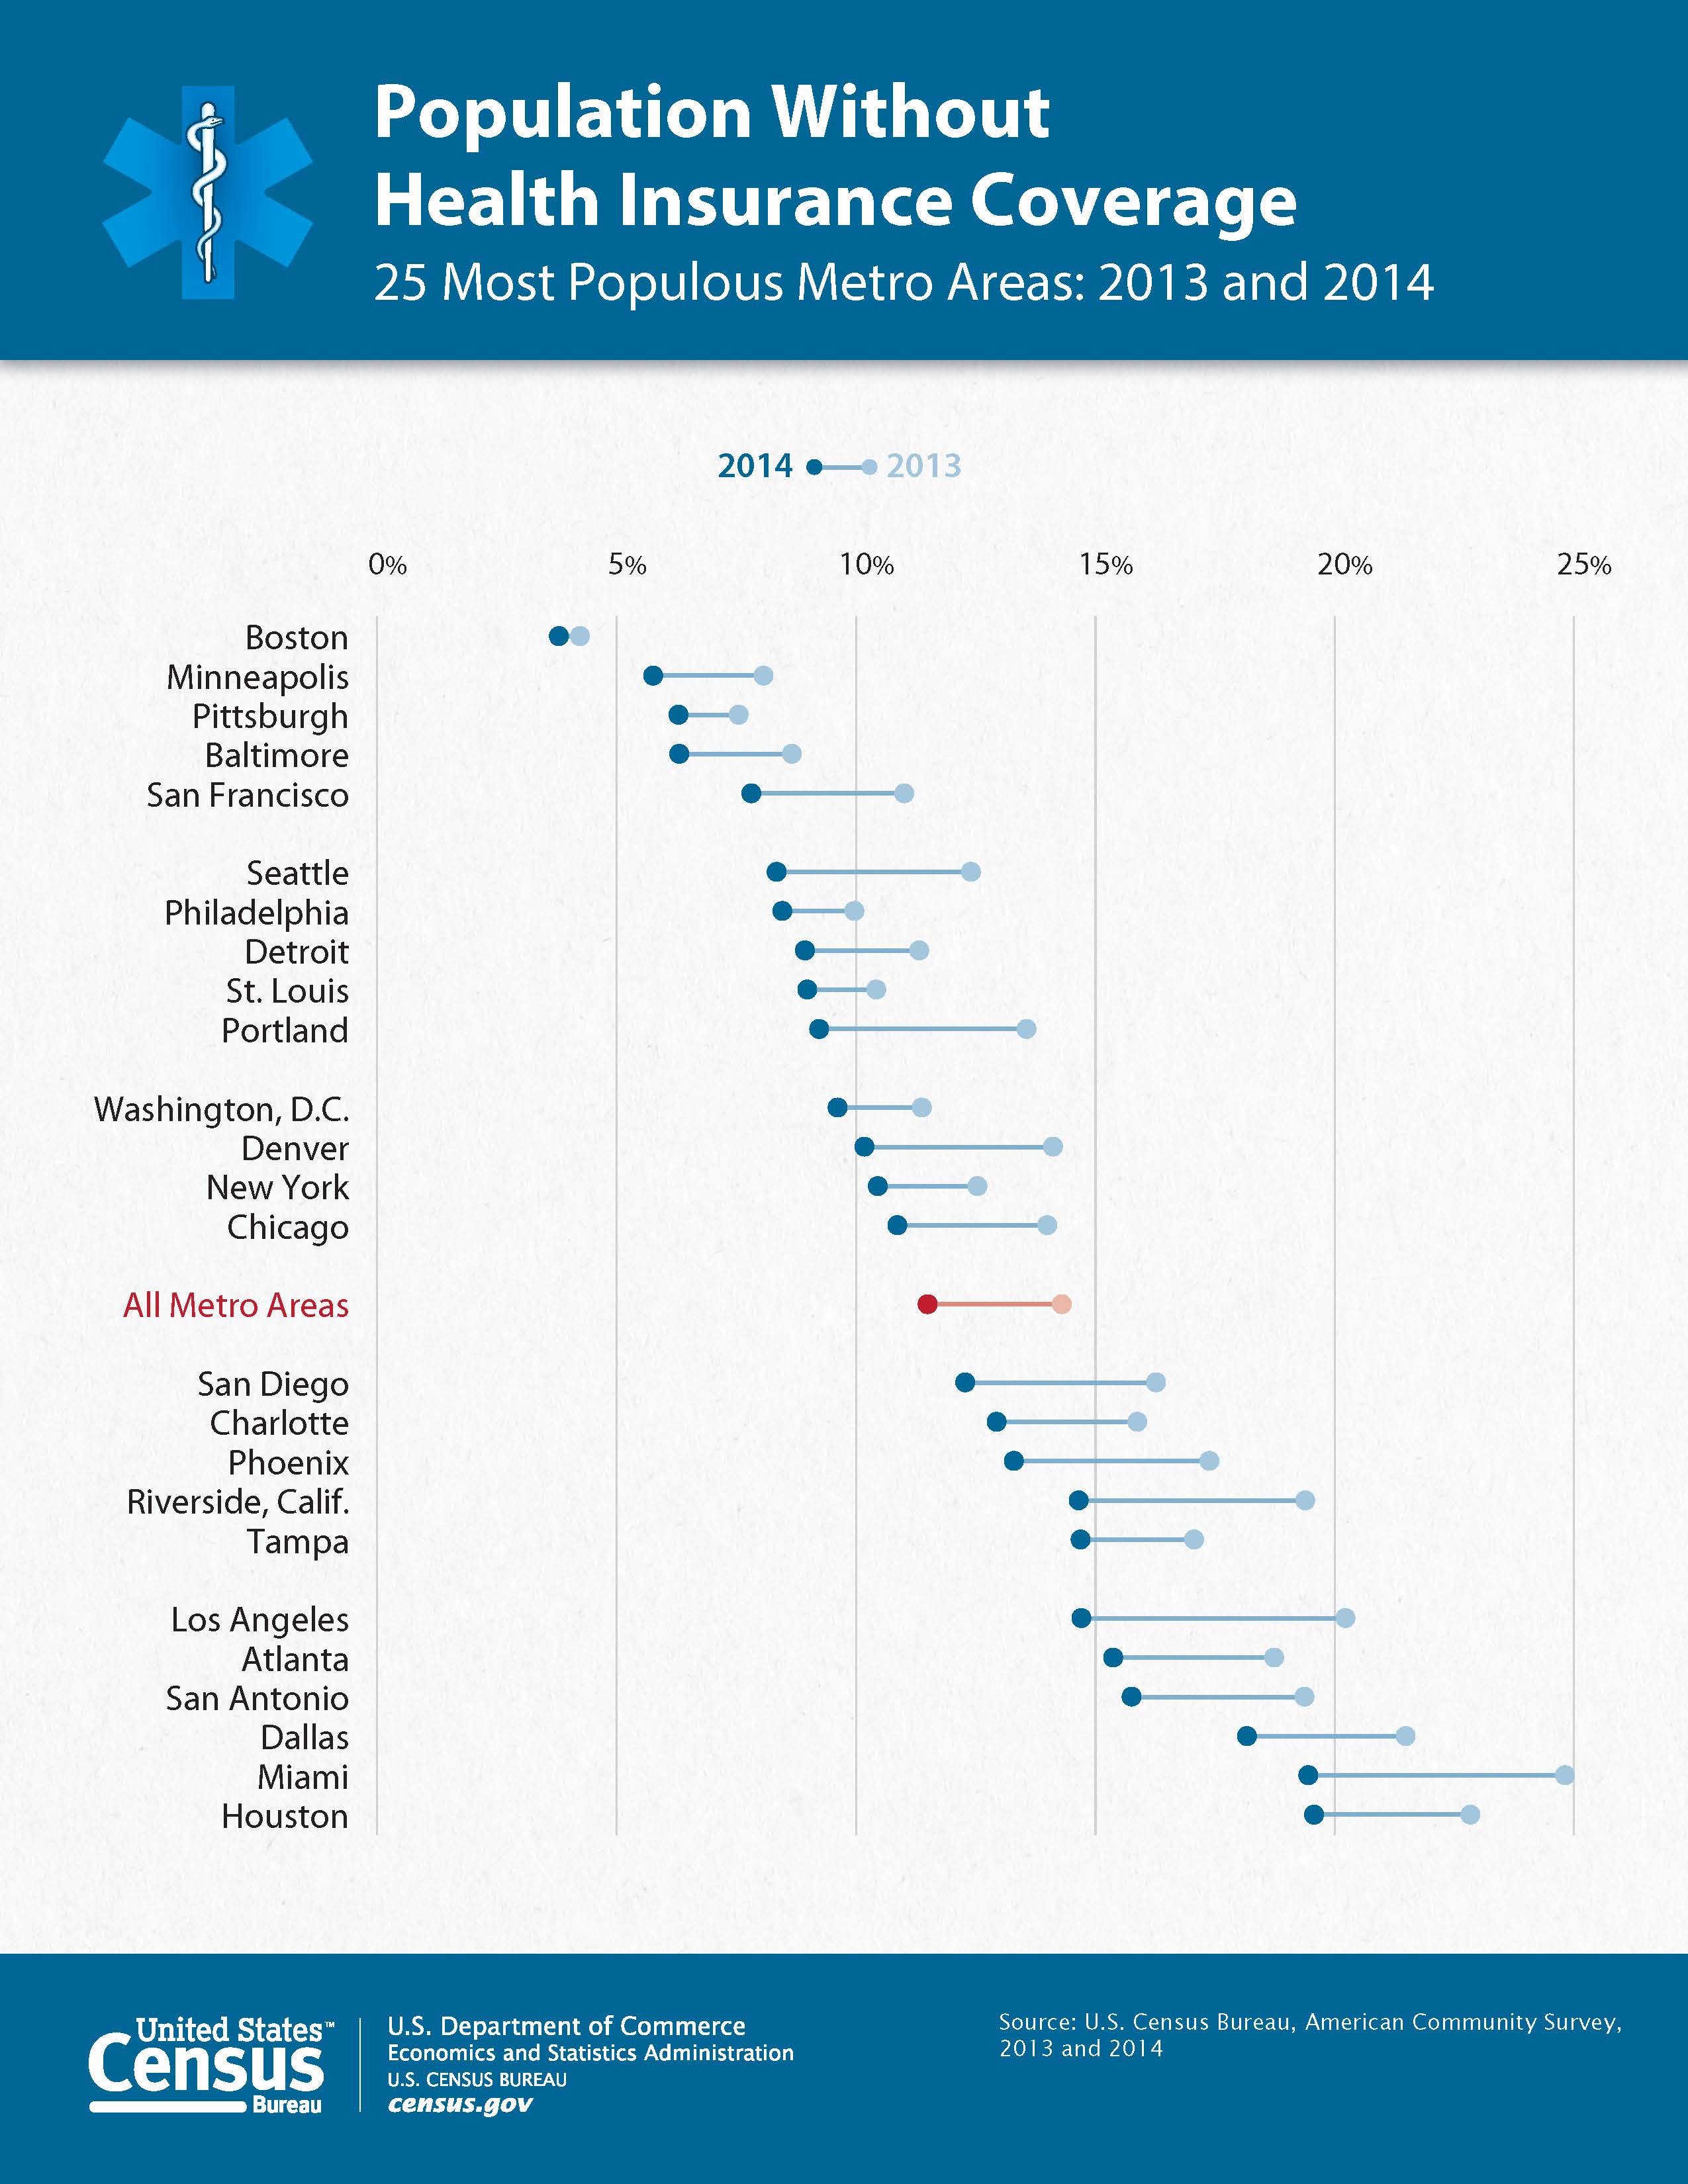
This hit #rstats today:
Has anyone made a dumbbell dot plot in #rstats, or better yet exported to @plotlygraphs using the API? https://t.co/rWUSpH1rRl
— Ken Davis (@ken_mke) October 23, 2015So, I figured it was worth a cpl mins to reproduce.
While the US gov did give the data behind the chart it was all the data and a pain to work with so I used WebPlotDigitizer to transcribe the points and then some data wrangling in R to clean it up and make it work well with ggplot2.
It is possible to make the top "dumbbell" legend in ggplot2 (but not by using a guide) and color the "All Metro A
| # Update and install necessary packages | |
| apt-get update | |
| apt-get install linux-image-$(uname -r|sed 's,[^-]*-[^-]*-,,') linux-headers-$(uname -r|sed 's,[^-]*-[^-]*-,,') | |
| # Download some extra packages, that do the trick for "wl module not found" | |
| wget http://http.kali.org/kali/pool/main/l/linux-tools/linux-kbuild-4.3_4.3.1-2kali1_amd64.deb | |
| wget http://http.kali.org/kali/pool/main/l/linux/linux-headers-4.3.0-kali1-common_4.3.3-5kali4_amd64.deb | |
| wget http://http.kali.org/kali/pool/main/l/linux/linux-headers-4.3.0-kali1-amd64_4.3.3-5kali4_amd64.deb | |
| # Install with correct order |
| # persistence from usb stick | |
| mkdir -p /mnt/my_usb | |
| mount /dev/sdb3 /mnt/my_usb | |
| echo "/ union" > /mnt/my_usb/persistence.conf | |
| umount /dev/sdb3 && reboot | |
| # get wifi working | |
| apt-get update | |
| apt-get install -y linux-headers-$(uname -r) broadcom-sta-dkms |
This guide started off as a sort of checklist for myself to try to refine, and speed up the process. I'm sure that there are a good number of things that can be improved upon, but in my opinion, the steps below produce pretty consistently good results. Hopefully this will help
| # Update and install necessary packages | |
| apt-get update | |
| apt-get install linux-image-$(uname -r|sed 's,[^-]*-[^-]*-,,') linux-headers-$(uname -r|sed 's,[^-]*-[^-]*-,,') | |
| # Download some extra packages, that do the trick for "wl module not found" | |
| wget http://http.kali.org/kali/pool/main/l/linux-tools/linux-kbuild-4.3_4.3.1-2kali1_amd64.deb | |
| wget http://http.kali.org/kali/pool/main/l/linux/linux-headers-4.3.0-kali1-common_4.3.3-5kali4_amd64.deb | |
| wget http://http.kali.org/kali/pool/main/l/linux/linux-headers-4.3.0-kali1-amd64_4.3.3-5kali4_amd64.deb | |
| # Install with correct order |